AP Inter 1st Year Economics 2nd Lesson Theory of Consumer Behaviour Questions and Answers
Essay Questions
Write an essay on the following questions.
Question 1.
Explain the Law of Diminishing Marginal Utility with the help of a diagram.
Answer:
Law of diminishing marginal utility :
It was originally explained by Hermann Heinrich Gossen in 1854. Hence it is called Gossen’s first law. But Alfred Marshall popularised this law and analysed it in a scientific manner.
Definition :
The additional benefit which a person derives from a given increase of his stock of a thing dimnishes with every increase in stock that he already has.
Explain:
Suppose a person starts eating slices of bread one after another. The first slice given him huge satisfaction and his appetite or hunger become less. The second slice yields less satisfaction. The satisfaction from the third slice is reduced further and that from the fourth will be lesser than that of the third. Thus, additional satisfaction will go on decreasing with every successive slice till it drops down to zero. If the consumer is forced to take more, his satisfaction may become negative or the utility changes into dissatisfaction.
| Units | Total Utility | Marginal Utility |
| 1 | 10 | 10 |
| 2 | 18 | 8 |
| 3 | 24 | 6 |
| 4 | 28 | 4 |
| 5 | 30 | 2 |
| 6 | 30 | 0 |
| 7 | 28 | – 2 |
The above table shows the change in total utility and marginal utility as the consumer consumes more and more units of a particles good in succession. It can be observed that the slices dimnishes from the business become zero at the 6th unit and then turns negative. The total utility (TU) goes on increasing at deminishing rate until the consumption of 5th unit. Where it becomes maximum and remains the same at the 6th unit, diminishing.
Graffical Illustration:
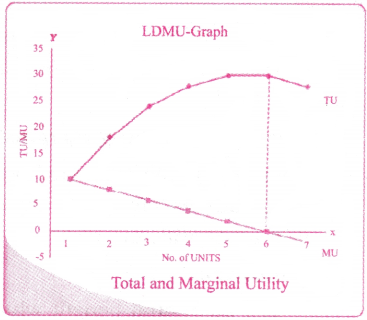
- It is geographically illustrated in the adjacent figure.
- The total utility and marginal utility curves have been obtained by plotting the data given in table.
- The TU curve is rising till the 6th unit of X is consumed it is to be noted that the TU curve is rising but at a diminishing, rate.
- After reaching the saturation point. TU starts to fall, where as the marginal utility curve is continuously falling and becomes zero.
- Beyond 6th unit consumed, it is to be noted the marginal utility turns negative.
- It means the additional consumption of good x yields disutility in the form of descomfort.
- Hence, with an increasing consumption the marginal utility gradually diminishes.
Question 2.
Describe the Law of Equi Marginal Utility with the help of a diagram.
Answer:
Introduction :
The law of equi-marginal utility is an extension of the law of diminishing marginal utility. The law of equi-marginal utility was presented in the 19th century by German economist H. H. Gossen It is also known as Gossen’s second law, law of maximum satisfaction and the law of substitution.
Definition of the law :
“If a person has a thing which can be put to several uses, he will distribute it among these uses in such a way that it has the same marginal utility in all”. – Alfred Marshall.
Explanation of the law : As consumer has unlimited number of wants, he spends his limited income on different goods, and tries to maximise his total satisfaction from the consumption of multiple goods. The consumer can get maximum satisfaction by allocating his income among different commodities in such a way that last rupee spend on each good provides the same marginal utility.
The fundamental condition for consumer’s equilibrium can be explained in the following way.
\(\frac{MUx}{Px}\) = \(\frac{Muy}{Py}\) = MUm
Where, MUx, MUy, = Marginal utility of good X and good Y,
MUm, = Marginal utility of money,
Px, Py = prices of good X and good Y.
Illustration :
This law can be explained with the help of a table and a diagram. Suppose the consumer has a limited money income Rs. 26/- and is prepared to spend on two goods X and Y. The market prices of two goods are Rs. 4 8s Rs. 5 respectively. Further, it is assumed that the marginal utility of money is constant at eight (8) utils. The allocation of money income and equilibrium of the consumer is explained in the following table 2.2.
| Units | MUx | MUx/Px | Units | MUY | MUY/PY |
| 1 | 44 | 11(1) | 1 | 45 | 9(3) |
| 2 | 40 | 10(2) | 2 | 40 | 8(6) |
| 3 | 36 | 9(4) | 3 | 35 | 7 |
| 4 | 32 | 8(5) | 4 | 30 | 6 |
| 5 | 28 | 7 | 5 | 25 | 5 |
In the above table, it is clear that the marginal utility of good X and good Y are decreasing due to the operation of the law of diminishing marginal utility. The column no 3 & 6 are calculated by dividing the marginal utilities of both goods at each unit of consumption with their corresponding prices (Rs. 4/- and Rs.5/ – respectively).
From the table, it is clear that being a rational consumer, he buys four units of good X and two units of good Y as the marginal utility of the fourth unit of good X is equal to the second unit of good Y. Thus, his total satisfaction from good X and good Y put together are 55 units which is the maximum. Suppose he spends his last rupee on good X rather from goodY, he get less marginal satisfaction and the total utility will be 54 units, but not 55. So he spends Rs. 16 on good X and Rs. 10 on good Y. Marginal utility of money is equal to the marginal utilities of X and Y (MUX = 32/4; MUY = 40/5, MUM = 8). Therefore, consumer will be in equilibrium at this level of consumption. Hence, this law is called as the law of maximum satisfaction.
Consumer equilibrium may be shown in the below diagram
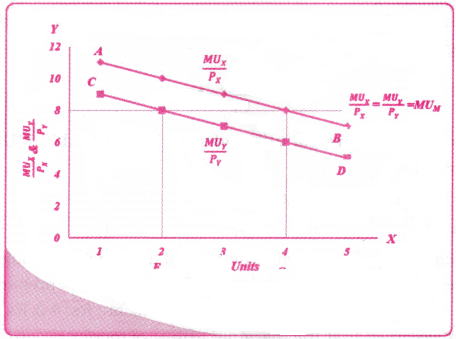
In the above diagram 2.2, the curves AB and CD are the marginal utility curves of good X and good Y respectively and both curves are slopping downwards.
Suppose the MU of money is constant at Rs. 8/-, \(\frac{\mathrm{MU}}{\mathrm{P}_{\mathrm{x}}}\) is equal to 8 when 4 units of good X is brought and \(\frac{\mathrm{MU}_{\mathrm{Y}}}{\mathrm{P}_{\mathrm{Y}}}\) is equal to Rs. 8/-, when 2 units of good Y is brought.
Thus, at equilibrium, \(\frac{\mathrm{MU}_{\mathrm{x}}}{\mathrm{P}_{\mathrm{x}}}=\frac{\mathrm{MU}_{\mathrm{x}}}{\mathrm{P}_{\mathrm{x}}}\) = MUm
Question 3.
Elucidate the Consumer Equilibrium under indifference curve analysis.
Answer:
Under indifference curve analysis, the equilibrium of the consumer can be explained with the help of an indifference map and price line/budget line.
Conditions of consumer equilibrium : Under indifference technique, a consumer reaches his equilibrium, when the following two conditions are satisfied.
- There should be tangency between price line and indifference curve. In other words, the slope of the price line should be equal to the slope of the indifference curve (MRS xy = \(\frac{P_x}{P_y}\))
- At the point of tangency where the slopes of indifference curve and price line are equal, the indifference should be convex to the origin.
Explanation of consumer equilibrium :
The following diagram explains consumer equilibrium.
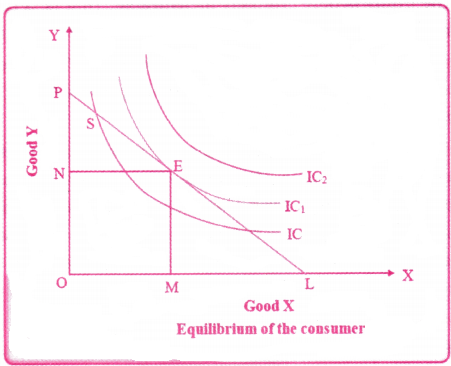
In the above diagram AB is the price line indicating an expenditure of Rs. 50. In the indifference map, there are 3 indifference curves IC1, IC2 and IC3.
At points P and Q, Indifference curve is intersecting the price line. At these points of intersection, the consumer gets lesser satisfaction with an expenditure of Rs. 50. But at point E, which is the point of tangency between price line and indifference curve 2, the consumer gets higher satisfaction / utility with the same expenditure of Rs. 50. So, P and Q the points of intersection between price line and indifference curve are not the points of consumer equilibrium. Only E, the point of tangency between price line and indifference curve 2, is the point of consumer equilibrium.
At the point E, (the point of tangency) IC2 is also convex to the origin. So, the consumer, by spending Rs. 50, and purchasing OM of X and ON of Y, is getting maximum possible satisfaction indicated by indifference curve 2.
Question 4.
Briefly discuss about the assumptions of Indifference curve analysis.
Answer:
Assumptions of Indifference curve analysis :
a) Rationality: The consumer is rational and possesses full information about all the relevant, aspects of economic environment in which he lives so as to get maximum satisfaction.
b) Scale of Preferences: All wants of a consumer are not of equal urgency or importance. Since his resources are limited and he cannot fulfill all his wants, he must pick and choose more important and more urgent wants for satisfaction. Thus, some wants take precedence over others. That is, a consumer ranks his wants and builds up a scale of preference.
c) Ordinal Utility: Unlike the cardinal utility approach, ordinal utility approach assumes the utility is only ordinally measurable. That is, a consumer is able to compare the satisfaction in ordinal terms i.e. 1st, 2nd, 3rd and so on.
d) Consistency or Transitivity of Choice : Consumer’s choices are assumed to be consistent. It means that if a consumer prefers A to B and B to C, he must prefer A to C.
e) Monotonic Preferences : Monotonic preference means that the consumer always prefers to have more of a commodity, as more quantity gives more satisfaction. In indifference curve analysis, it means that the consumer prefers a combination that has atleast more of one good, when compared to another combination. E.g., Suppose there are combinations A (2X + 3Y) and B (4X + 3Y), the consumer prefers combination B which has more of good X.
f) Substitution : To be on the same level of satisfaction, if the quantity of one good is substituted with another good in a bundle of two goods. He substitutes the good that gives less satisfaction, for a good that gives more satisfaction. Rate of substitution is that rate at which the quantity of one good is forgone for the gain of one unit of the other.
Short Answer Questions
Question 1.
Explain the properties of indifference curves.
Answer:
Indifference curves are a fundamental concept in microeconomics, particularly in consumer theory. There are some key properties.
i. Downward slopping :
Indifference curves slope downward from left to right indicating that as the quantity of one good increases, the quantity of the other good must decrease to maintain in the same level.
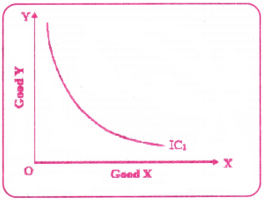
ii. Convex to origin :
Indifference curves convex to the origin, meaning that they bow inward toward the origin. This reflects the diminishing marginal rate of substitution between the two goods.
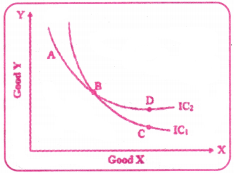
iii. Non-intersecting :
Indifference curves do not intersect each other. If they did, it would imply that the same bundle of goods provide two different levels of satisfaction which is not possible.
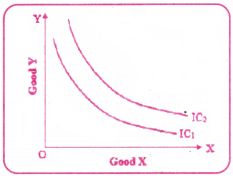
iv. Higher curves represent higher satisfaction :
Indifference curves that are farther from the origin represent higher levels of satisfaction. This is because they represent more goods or services being consumed.
v. Continuous and Smooth :
Indifference curves are typically assumed to be continuous and smooth reflecting the idea that consumers can make marginal adjustments to their consumption bundles.
Question 2.
What are the assumptions of Marginal Utility Analysis ?
Answer:
Definition of Law : The additional benefit which a person derives from a given increase of his stock of a thing diminishes with every increase in stock that he already has. – Alfred Marshall.
Meaning : Law that explain the relationship between quantity consumed and utility derived from each successive unit consumed is called the law of diminishing marginal utility. The law says that as a consumer consumes more and more units of a good the extra satisfaction that he derives from extra unit of a good goes on falling.
Assumptions :
- Rationality : This law assumed that the consumer is a rational being in the sense that he seeks to maximize satisfaction.
- Cardinal measurement of utility : Utility is a quantifiable entity and is measurable.
- Hypothesis of Independent utility : It implies that the utility of any commodity depends on its own quantity.
- Constant marginal utility of money : The marginal utility of money remains constant throughout when the individual is spending money on a good.
- Homogeneous : All units of a good are homogeneous in the sense they are alike both quantitatively and qualitatively.
- No time gap : This law assumed that there is no time lag between the consumption of one unit and another.
- Constancy : It implies the income, tastes, and preferences of the consumer remain constant.
Question 3.
Define Budget line. Explain with the help of a diagram.
Answer:
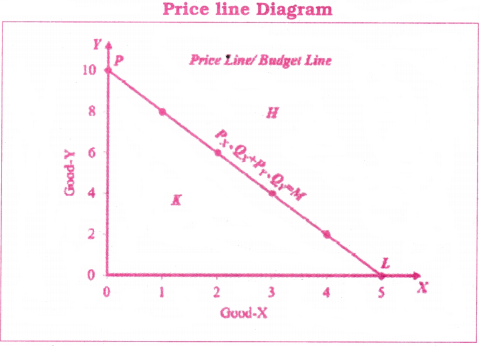
A budget line, also known as price line, shows different combinations (quantities) of two goods (X and Y or mangoes and oranges) that can be purchased by the consumer, with a given income (Rs. 50) and with the prices X (Mangoes) Rs. 10 and with the price of Y (oranges) Rs. 5. It is also known as ISO expenditure line. Any point on the same price line/budget line results in the same or equal expenditure to the consumer. It can be drawn by connecting or joining maximum quantities of X and Y.
Price line Diagram
Question 4.
Draw a diagram showing shifts in budget line due to change in the price of Good Y.
Answer:
Shifts in budget line or price line take place with a change in the income of the consumer, with the price of X (mangoes) and Y (oranges) remaining constant.
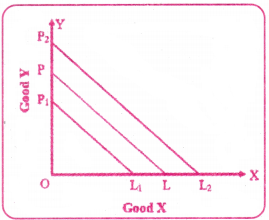
In the above diagram, PL is the original Price line/Budget line, showing an expenditure Rs. 150 and income of Rs. 150. When his income has increased to Rs. 200/- he would be able to spend to Rs. 200, and new price line has shifted to the right of the original, and it is P1L1. When there is a decrease in his income, he would be able to spend only Rs.100. The new price line has shifted to the left of the original one, and it is P2L2.
Question 5.
Write the limitations of the Law of Diminishing Marginal Utility.
Answer:
The following cases are some of the exceptions to the law of diminishing marginal utility.
- This law does not apply to money.
- Hobbies such as collection of stamps, old paintings, coins etc., are exceptions to the law of diminishing marginal utility.
- It is pointed out that the consumption of liquor is not subject to the law of diminishing marginal utility. The more a person drinks liquor, the more he likes it.
- Further, the law does not hold good if any change in income of the consumer, tastes and preferences occurs in the middle.
Question 6.
Briefly write about the Assumptions of Law of Equi Marginal Utility.
Answer:
The followings are the assumptions of law of equi Marginal Utility.
- Utility is cardinally measurable.
- The marginal utility of money is constant.
- Consumer is rational.
- Income of the consumer is given and constant.
- Prices of the commodities are given and constant.
- The law of diminishing marginal utility operates.
Question 7.
What are the short comings of Marshall in utility analysis ?
Answer:
The following are the main defects pointed out in the Marshallian approach.
- Cardinal measurability of utility is not possible.
- Assumption of independent utilities is unrealistic.
- Assumption of constant marginal utility of money is unrealistic.
- This is one commodity model.
- Income effect, price effect and substitution effect are not clearly broughtout.
Question 8.
Write about Indifference Map.
Answer:
The consumer’s preferences over all the combinations can be represented by a family of indifference curves as shown in Figure. This is called an indifference map of the consumer. All points on each indifference curve represent combinations which give equal level of satisfaction to the consumer.
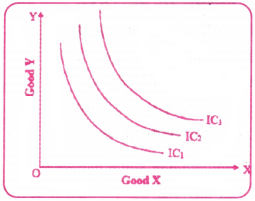
Monotonicity of preferences implies that between any two indifference curves, the consumer prefers the one which gives him more satisfaction. Obviously it contains more of either or both the goods. In fig. the IC curves are numbered and arranged in ascending order from left to right. As we move from the lower number to the higher number or from left to right, the level of satisfaction increases.
Question 9.
What are the assumptions of consumer equilibrium ?
Answer:
Assumptions :
- Consumer has an indifference map showing his scale of preferences which remains the same throughout the analysis.
- Money income is given and remains constant.
- Prices of the two goods are given and will remain constant.
- The consumer is rational and tries to maximize his satisfaction.
- There is no change in tastes and habits of the consumer.
Question 10.
Write a short note superiority of the I.C. Technique.
Answer:
The indifference curve analysis is superior to utility analysis
- as it dispenses with the asumption of measurability of utility,
- it studies consumption of more than one commodity at a time which is realistic in life,
- it does not assume constancy of money, and
- it segregates income effect from the substitution effect.
Very Short Answer Questions
Question 1.
Difference between Cardinal Utility and Ordinal Utility.
Answer:
| Cardinal Utility | Ordinal Utility |
| 1. It can be quantified or expressed or measured in numerical terms numbers. | 1. It cannot be expressed or measured or in number or numerical terms. |
| 2. Consumer can say clearly how much more or how much less utility he gets from different goods. | 2. Consumer cannot say how much or how much less he gets from different goods. |
Question 2.
Relation between Total Utility and Marginal Utility.
Answer:
- As long as Marginal Utility is positive, total utility increases but at a decreasing rate.
- When Marginal Utility becomes zero, total utility reaches its maximum- this is called the point of saturation.
- If marginal utility turns negative (from further consumption), total utility starts to decrease.
Question 3.
Marginal Utility.
Answer:
It can be defined as the additional utility derived from an additional unit consumed. It is also defined as the addition to the total utility derived from the consumption of one additional unit. In short, Marginal Utility is the change in the total utility, resulting from the consumption of one additional unit.
Question 4.
Law of Equi Marginal Utility.
Answer:
It is an extension of the law of diminishing marginal utility. It was presented in the 19th century by German .economist H.H. Gossen. According to Alfred Marshall, If a person has a thing which can be put to several uses, he will distribute it among these uses in such a way that it has the same marginal utility in all.
Question 5.
Find the Marginal Utility from the given table.
| Units of X | Total Utility | Marginal utility |
| 1 | 40 | |
| 2 | 70 | |
| 3 | 90 | |
| 4 | 100 | |
| 5 | 100 | |
| 6 | 90 |
Answer:
| Units of X | Total Utility | Marginal utility |
| 1 | 40 | 40 |
| 2 | 70 | 30 |
| 3 | 90 | 20 |
| 4 | 100 | 10 |
| 5 | 100 | 0 |
| 6 | 90 | 10 |
Question 6.
Indifference curves.
Answer:
An indifference curve can be defined as “the locus of points each representing a different combination of two goods yielding the same utility or level of satisfaction”. Therefore, a consumer is indifferent between any two combinations of goods when it comes to making a choice between them. It is also called “iso-utility curve” and “equal utility curve”.
Question 7.
Condition of transitivity.
Answer:
Transitivity is important because it ensures rational decision-making by consumers. If preference are not transitive, it can lead to cycles and inconsistencies, making it difficult for consumers to make clear choice. Overall, transitivity helps in creating predictable patterns in consumer behaviour, which is crucial for economists and marketers in understanding and analyzing purchasing decisions.
Question 8.
Marginal Rate of Substitution (MRS).
Answer:
Marginal Rate of Substitution is such substitution of one good for another (two different goods) which results in or gives the same level of satisfaction to the consumer before substitution and after substitution.
Question 9.
Price Line / Budget Line.
Answer:
A price line, also known as budget line, shows the different (quantities) combinations of two goods (namely X and Y or mangoes and oranges) that can be purchased by the consumer with a given income (Rs.50/) and with given prices of X (Rs.10) and Y (Rs.5). Price line is aso known as budget line or Iso expenditure line. Any point on the same price line / budget line results in the same or equal amount of expenditure to the consumer.
Question 10.
Consumer Equilibrium.
Answer:
A consumer is said to be in equilibrium when he obtains the maximum satisfaction. Under this analysis, with the given scale of preference and budget line.
One Word Answer Questions
Answer the following questions in ONE WORD.
Question 1.
When total utility is maximum, then marginal utility ?
Answer:
Zero
Question 2.
The sum of marginal utilities equal to :
Answer:
Total Utility.
Question 3.
The equation of consumer equilibrium under the law of equi marginal utility is :
Answer:
Question 4.
Consumer’s choice are assumed to the transitive that, if a consumer prefers A to B and B to C he must prefer :
Answer:
A to C.
Question 5.
From the budget equation if Px = 5, Qx = 2, Py = 3, Qy = 5. Then calculate the money income (M) of the consumer.
Answer:
Px . Qx + Py . Qy = M
So, 5 × 2 + 3 × 5 = 10 + 15 = 25 Rs.
Fill in the blanks
Question 1.
In __________ utility analysis, utility can be measured in definite numbers such as 1, 2, 3, 4, etc.
Answer:
Cardinal
Question 2.
The Law of Diminishing Marginal Utility states that when more and more units of commodity is consumed, the marginal utility __________.
Answer:
Decreases
Question 3.
Indifference curves are always __________ to the origin.
Answer:
Convex
Question 4.
The slope of indifference curve is measured by __________
Answer:
MRS (The Marginal Rate of Substitution)
Question 5.
A set of indifference curves drawn in a graph is called __________
Answer:
Indifference Map
Multiple Choice Questions
Question 1.
Which of the following is true about the relationship between TU and MU?
1. The TU is maximum, when the MU is negative
2. The TU decreases, when the MU is negative
3. The TU increases at a decreasing rate, when the MU is negative
4. The TU is constant, when the MU is negative
Answer:
2. The TU decreases, when the MU is negative
Question 2.
The total utility that Rahul derives after consuming 4 oranges is 20, whereas, the total utility on consuming 5 oranges is 19. What is the marginal utility for 5th orange?
1. 1
2. 0
3. – 1
4. ± 1
Answer:
3. – 1
Question 3.
The marginal utilities of good X and good Y are 300 and 450 utils, at equilibrium respectively. If the price of the good Y is Rs. 60, what is the price of good X at equilibrium ?
1. Rs. 55
2. Rs. 75
3. Rs. 40
4. Rs. 60
Answer:
3. Rs. 40
Question 4.
The convex shape of indifference curve is due to :
1. Increasing MRS
2. Decreasing MRS
3. Constant MRS
4. Positive MRS
Answer:
2. Decreasing MRS
Question 5.
A parallel rightward shift in budget line is due to :
1. Increase in price of good X
2. Increase in price of good Y
3. Increase in income of the consumer
4. Scale of Preference
Answer:
3. Increase in income of the consumer